Total client services
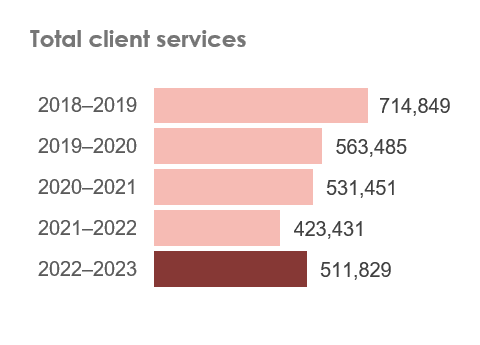
2018–2019: 714,849
2019–2020: 563,485
2020–2021: 531,451
2021–2022: 423,431
2022–2023: 511,829
Legal representation*
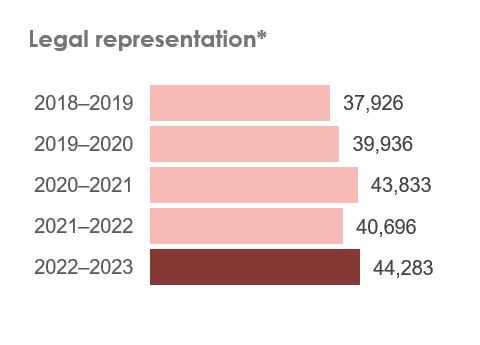
2018–2019: 37,926
2019–2020: 39,936
2020–2021: 43,833
2021–2022: 40,696
2022–2023: 44,283
Legal advice services
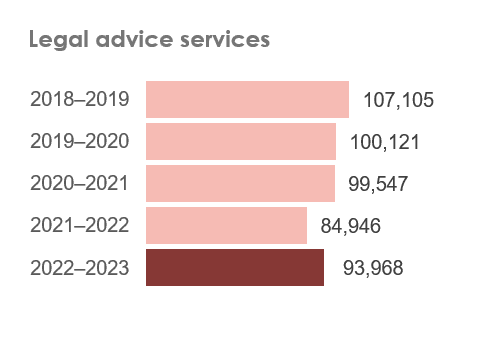
2018–2019: 107,105
2019–2020: 100,121
2020–2021: 99,547
2021–2022: 84,946
2022–2023: 93,968
Duty services at courts and tribunals
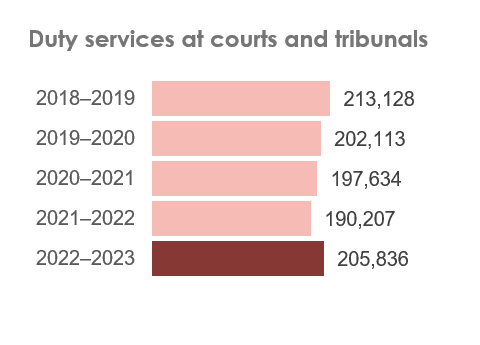
2018–2019: 213,128
2019–2020: 202,113
2020–2021: 197,634
2021–2022: 190,207
2022–2023: 205,836
Family law mediations
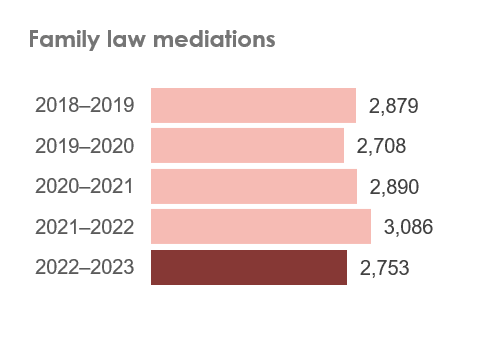
2018–2019: 2,879
2019–2020: 2,708
2020–2021: 2,890
2021–2022: 3,086
2022–2023: 2,704
Minor assistance services
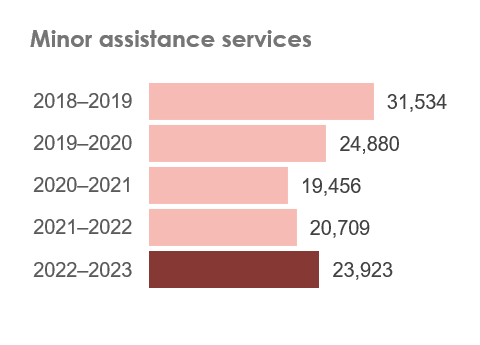
2018–2019: 31,534
2019–2020: 24,880
2020–2021: 19,456
2021–2022: 20,709
2022–2023: 23,923
Aboriginal and Torres Strait Islander clients**
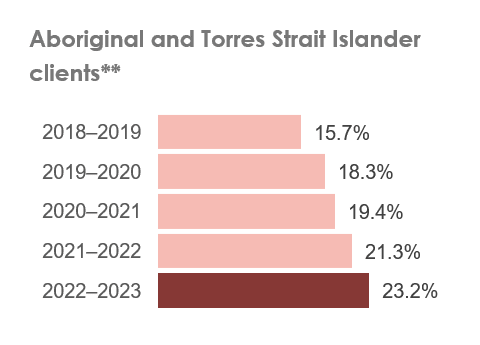
2018–2019: 15.7%
2019–2020: 18.3%
2020–2021: 19.4%
2021–2022: 21.3%
2022–2023: 23.2%
Community legal education sessions***
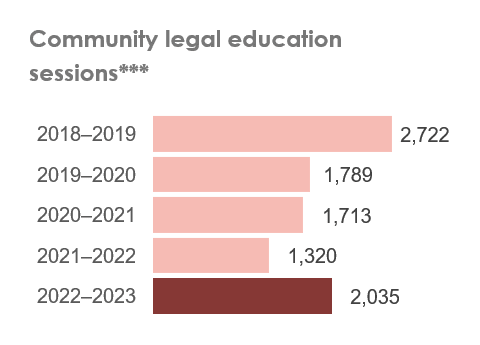
2018–2019: 2,722
2019–2020: 1,789
2020–2021: 1,713
2021–2022: 1,320
2022–2023: 2,035
*Extended legal assistance and early resolution assistance are now included as part of all legal representation figures. This differs from how these services were presented in earlier annual reports.
**For 2018–2019, this graph shows the proportion of casework services and in-house duty services provided to Aboriginal and Torres Strait Islander clients. From 2019–2020 onwards, in-house duty services are not included in this calculation.
***Community legal education figures for 2021–22 have been revised following the identification of system issues that had previously resulted in undercounting. In last year’s report, we stated that we provided 797 community legal education sessions in 2021–22. The correct figure is 1,320.
Share with
Facebook
Twitter
LinkedIn